First day cover ·
QQQ vs. SPY: What Two Decades of Returns Reveal About Risk
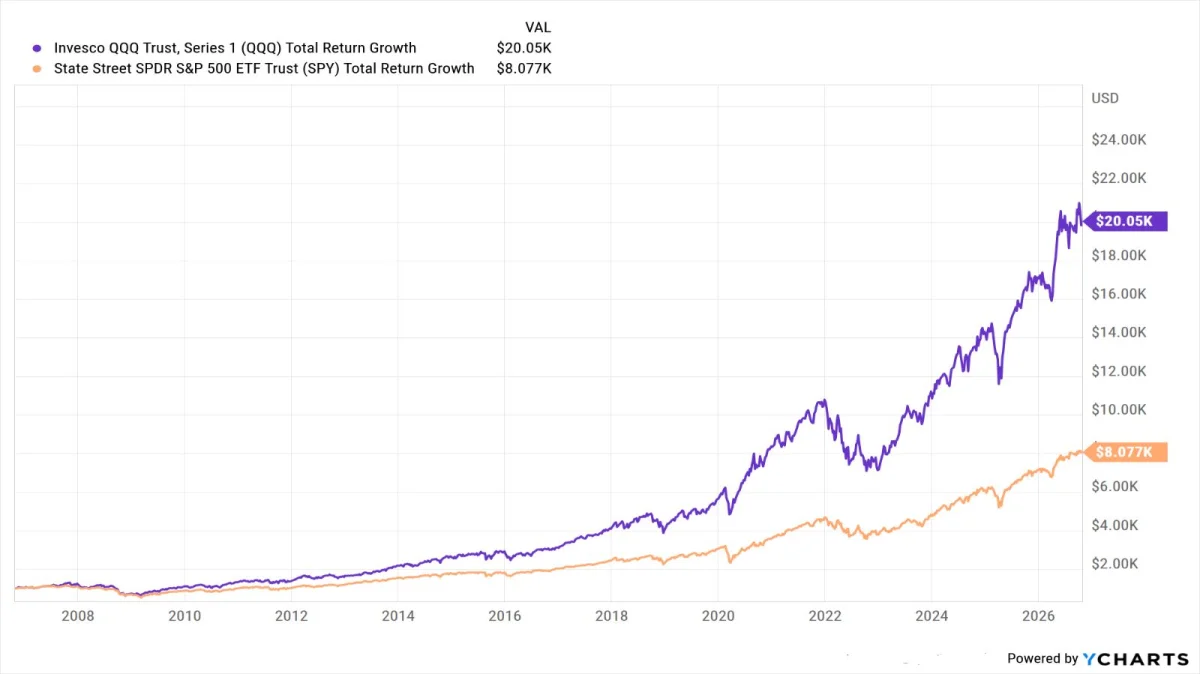
A $1,000 investment grew to $20,000 in QQQ or $8,000 in SPY over 20 years, with higher gains in QQQ accompanied by deeper declines.
Over the 20 years covered by the source, a $1,000 investment in the Invesco QQQ Trust would have grown to $20,000, including reinvested dividends. The same amount in the SPDR S&P 500 ETF would have reached $8,000. Those figures show how strongly technology’s rise shaped market performance, and how a larger historical gain came with a rougher ride along the way.
The difference reflects what each fund holds. QQQ tracks the 100 largest nonfinancial companies listed on Nasdaq. SPY tracks the S&P 500, a broader group that includes many more companies and a wider mix of industries. Their results aren’t interchangeable: each fund’s structure affects how much any one sector or company can influence its performance.
Why QQQ pulled ahead
Technology and communications companies gained prominence over the period, from mobile and social media to cloud computing and artificial intelligence. QQQ gave investors exposure to many of the large companies at the center of that shift. Its five biggest holdings named in the source are Nvidia, Apple, Microsoft, Micron Technology and Amazon.com, together making up 30% of the fund.
That concentration can magnify gains when major holdings rise. Apple, Microsoft and Nvidia carry a larger share of QQQ than they do in SPY, so their growth has had a greater effect on QQQ’s overall results. The source also notes that technology and communications companies make up almost 48% of the S&P 500. Even so, SPY’s much larger number of holdings means those companies have less influence on its total than they do in QQQ.
QQQ’s long-term figures were striking: the $1,000 grew to $20,000, equal to an annualized total return of 16.1%. Total return includes price changes and reinvested dividends. SPY’s $1,000 grew to $8,000, or an annualized 11%. That’s a strong result in its own right, though it trailed QQQ over the same period.
What broader exposure changed
SPY holds companies across more parts of the economy, including banks and insurance companies. QQQ excludes financial companies. The source links the financial sector’s weaker period after the 2008 financial crisis, alongside very low interest rates, to a drag on financial stocks and the S&P 500’s relative performance during that stretch. Financial companies account for almost 12% of the S&P 500 today, according to the source.
Holding more companies and industries can reduce the effect of a setback at any one business or sector. It doesn’t prevent losses when markets fall, and it didn’t keep SPY from declining. But in the comparison presented, SPY had less volatility than QQQ. That difference matters when weighing the end value alone: a higher historical gain can be harder to live with if an investor is uncomfortable with sharper drops along the way.
The cost of QQQ’s bigger gains
The source reports that when interest rates rose rapidly in 2021 and 2022, QQQ fell 36% from its peak. SPY’s decline was roughly 25%. These drawdowns help put the 20-year totals in context. QQQ’s greater exposure to high-growth technology companies helped lift its result during a period when those businesses prospered, while also leaving it more exposed when the market repriced them.
That’s the central trade-off in this comparison. QQQ’s history shows what can happen when a concentrated fund’s largest holdings lead the market for years. It also shows that a fund built around those companies can fall further when conditions turn against them. SPY spreads exposure more broadly, which corresponded to a smaller decline in the downturn described, but its gains over the period were lower.
Read the comparison as a trade-off
These figures describe the period in the source; they don’t establish what either fund will do in the future. The result depends on the start and end dates, and a long-run average doesn’t show the timing or emotional strain of losses along the way. Reinvested dividends are also part of the stated total return figures, so they shouldn’t be compared with price changes alone.
For readers comparing the funds, the useful question isn’t only which one ended with more. It’s how much concentration and volatility they could tolerate, and whether they want exposure to a narrower group of large Nasdaq-listed companies or a broader collection of S&P 500 businesses. The past 20 years offer a clear example: QQQ’s stronger outcome came with deeper declines, while SPY’s broader mix delivered a lower return with less volatility.
For another view of the figures, the source’s chart is credited to YCharts.
For a closer look at the companies mentioned in the source, see these related pieces: